Property
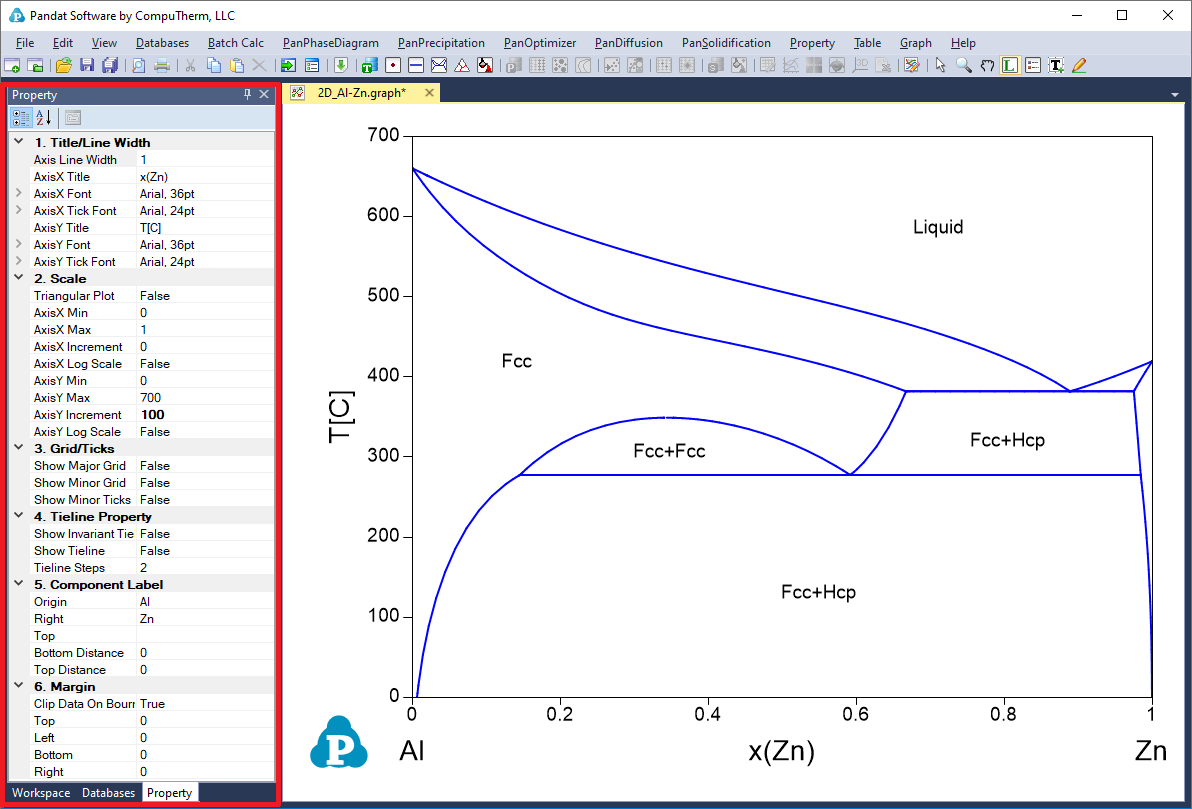
The overall property of a graph consists of six categories: Title/Line Width, Scale, Grid/Ticks, Tieline Property, Component Label and Margin, as shown in the red box area in Figure 1 All six categories will be shown in “Property” window when the whole graph is selected. The “Title” property defines the axis line width, the title, title font size and tick font size for both X axis and Y axis. The “Scale” property defines the minimum and maximum values, increment and Log scale status for both X and Y axises and a flag of “Ternary Plot”. If this flag is set as “True”, the figure is plotted as Gibbs triangle for a normal isothermal section and only the increments are also shown in the Scale property. If the flag is set as “False”, a Cartesian coordinate figure will be plotted. The “Grid/Ticks” property defines whether to show grids on the graph or ticks on the axis. The “Tieline” Property defines whether to show the tie-lines and the density of the tie-lines. The “Component label” defines the labels on the origin, right corner and Top corner of the graph. The “Margin” property defines the position of the plot in the Main display window.
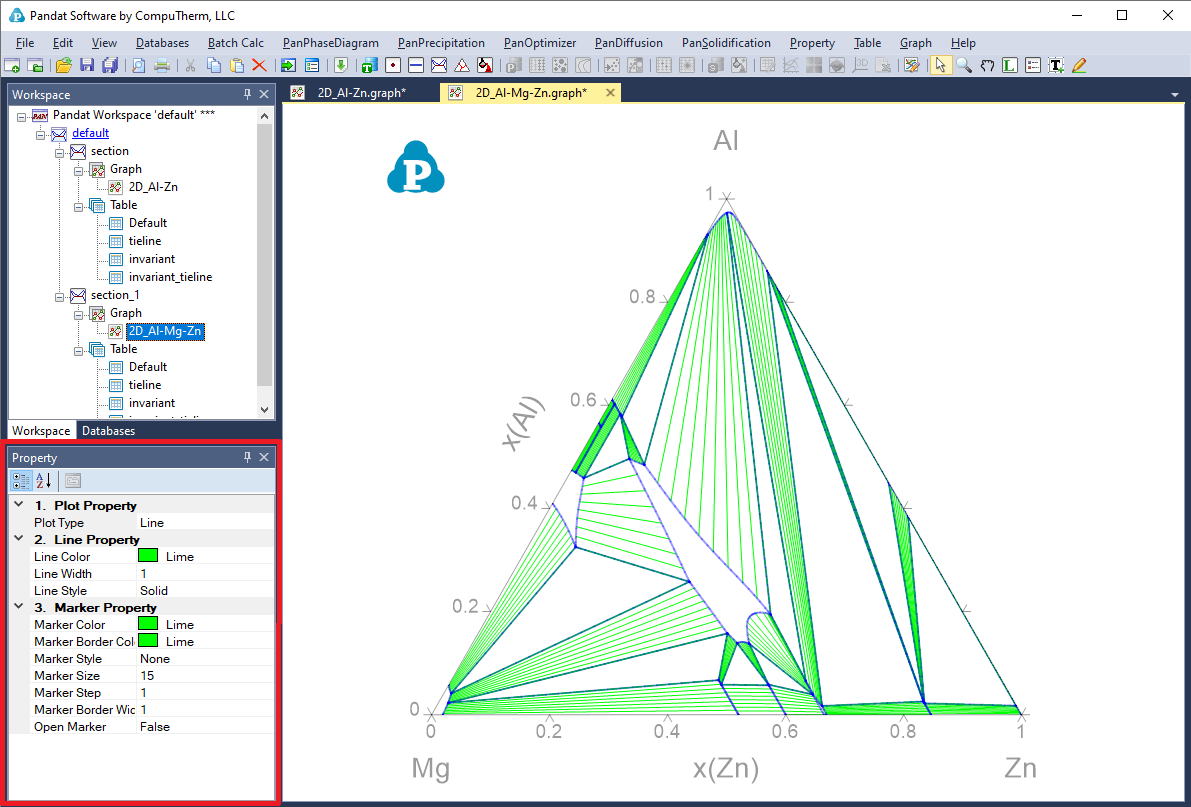
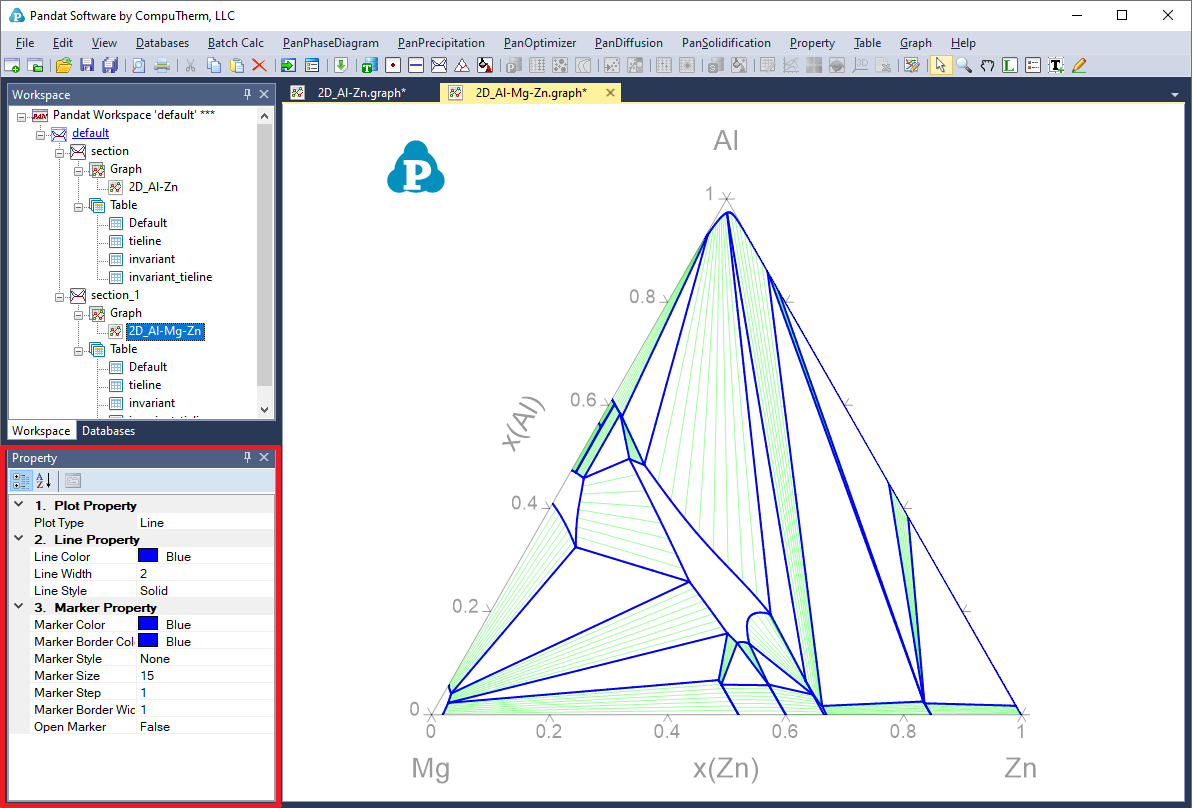
The other properties of the tie-lines, such as the color, the style, are defined by individual property window associated with these tie-lines. These properties can be modified when only the tie-lines on the Main Display window are selected and highlighted as shown in Figure 2. User can change the appearance of a set of lines belonging to the same group by selecting this line (or a group lines) only. The properties for such data plots, such as the line color, thickness, marker type, will show up in the Property window for user to modify. The data points and lines selected will be highlighted in the graph while the others will be grey. As shown in Figure 3, the phase boundary lines are selected as a group of lines to be modified in this case. The properties of this group lines are defined in the “Plot Property” window as “Blue, Solid, None marker” lines. All these properties can be modified in the Property Window as framed by the red line in Figure 3. The “Line Property” defines the property of the line and the “Marker Property” defines the property of the point on the graph.
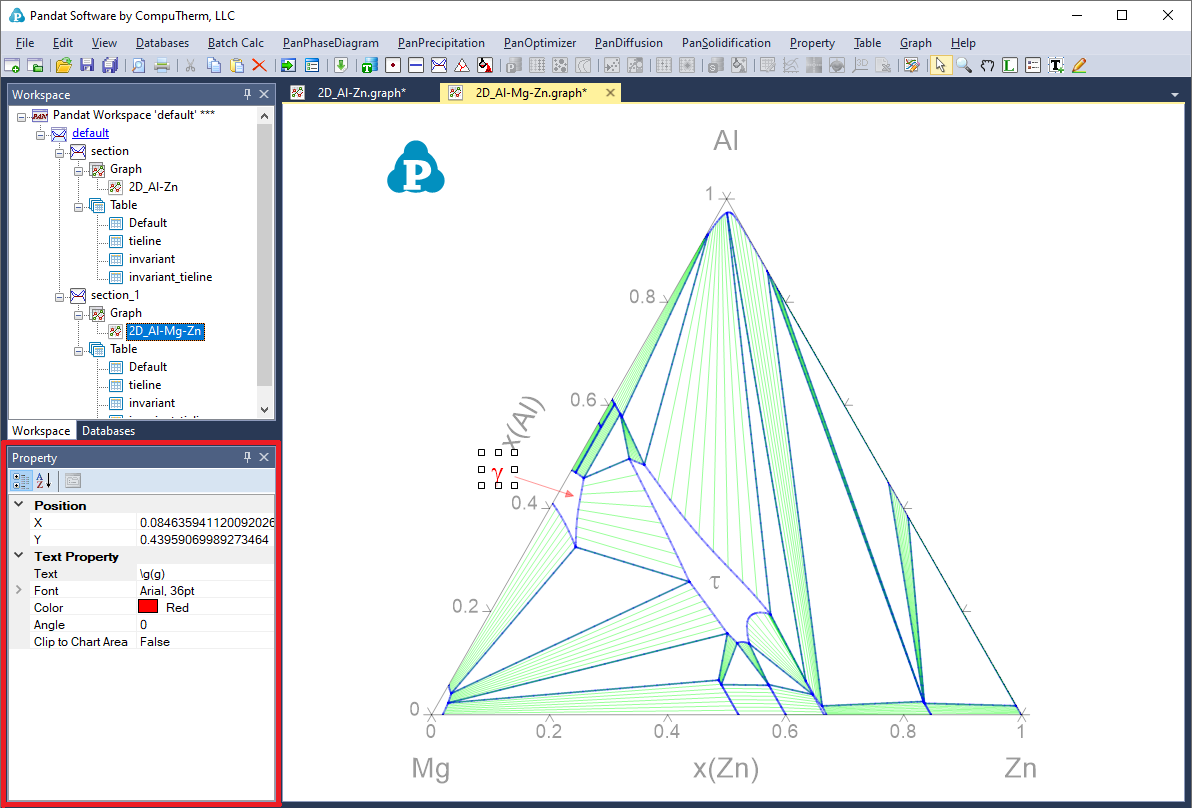
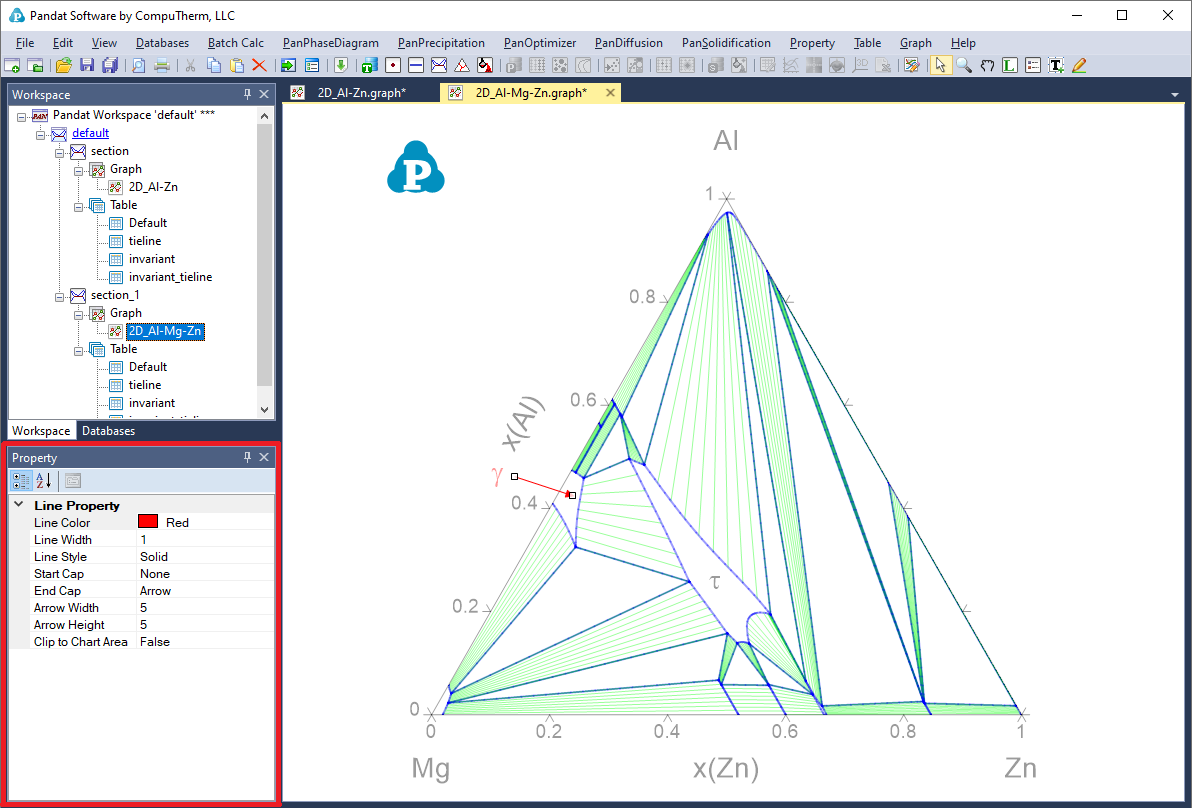
User can add texts and lines/arrows freely to the graph. The “Text Property” defines the position, content, font size, color and rotating angle of the text, as shown in the red box in Figure 4 when the text box is selected. The “Line Property” defines the color, width, start cap and end cap of the line as shown in the red box in Figure 5 when the line/arrow is selected.